I recently learned that my parents have been carrying around an A4 printout of this poster in an attempt to help explain to curious acquaintances what it is I actually do as a research mathematician. This is quite a nice thing to do, but the reader may immediately recognise this as a gross mismatch of intended and actual audience.
The challenge this presents is clear — to create an audience-appropriate, pamphlet-sized, self-contained explanation of my work. This of course shares a lot with the more familiar elevator pitch, with a couple of key differences. The main additional challenge is that, unlike over a pint at the pub, the narrator is unable to adapt to their audience. One must anticipate and address as many questions as possible in a fixed amount of space, and cannot lean on the specific expertise of the reader. On the other hand, a print-out can immediately call upon a carefully constructed and tailor-made diagram, whereas at least one of these criteria must usually be abandoned in impromptu settings. I encourage you to attempt your own version of this exercise, it’s rather entertaining and informative.
Here is my present attempt. I’m sure it will remain in a state of perpetual beta testing, so don’t hesitate to provide feedback if you so desire.
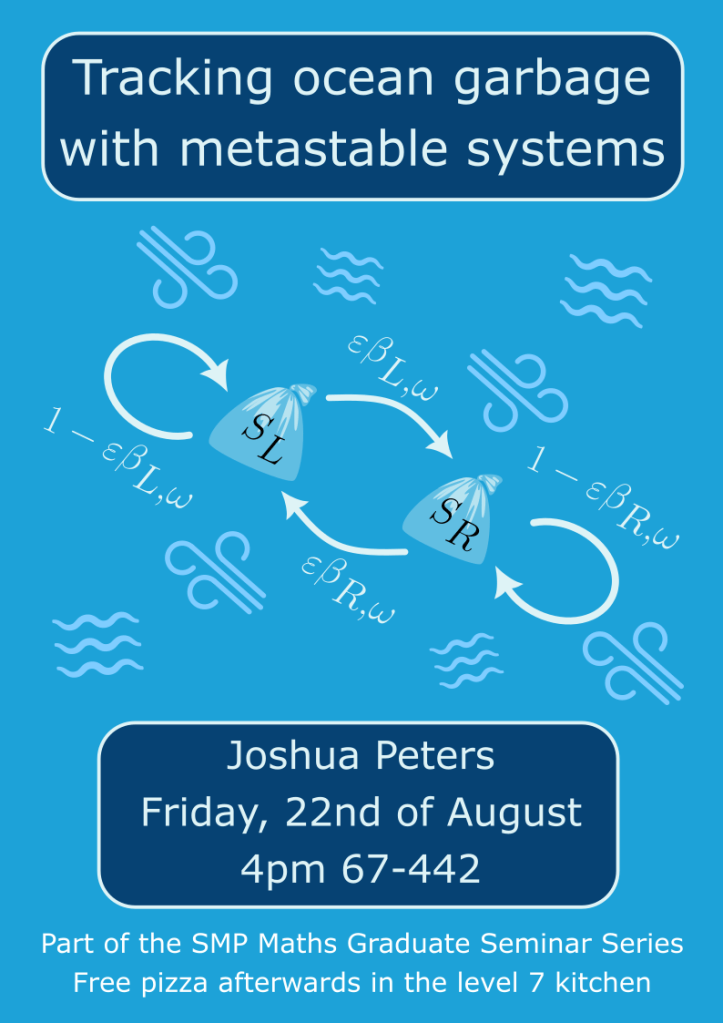
I’ve been part of the organising committee for the SMP Maths Graduate Seminar Series since the start of the semester. During a boots-on-the-ground door-knocking campaign, we realised that a few posters put up around the place would really boost our attendance. The main purpose is to reach the eyeballs of our colleagues who are less inclined to checking their emails, but of course it also imbues the series with a greater sense of professionalism. I’ve been in charge of poster design, and I’m proud of the work, so I’m going to share the results here.
Well, I’m not going to apply for any graphic design jobs any time soon! But I reckon it’s alright for a mathematician. You can see a rough template and theme developing over the semester. All the posters are produced with Inkscape, which I’ve had a real fondness for ever since Rhuaidi Burke recommended it to me earlier this year.
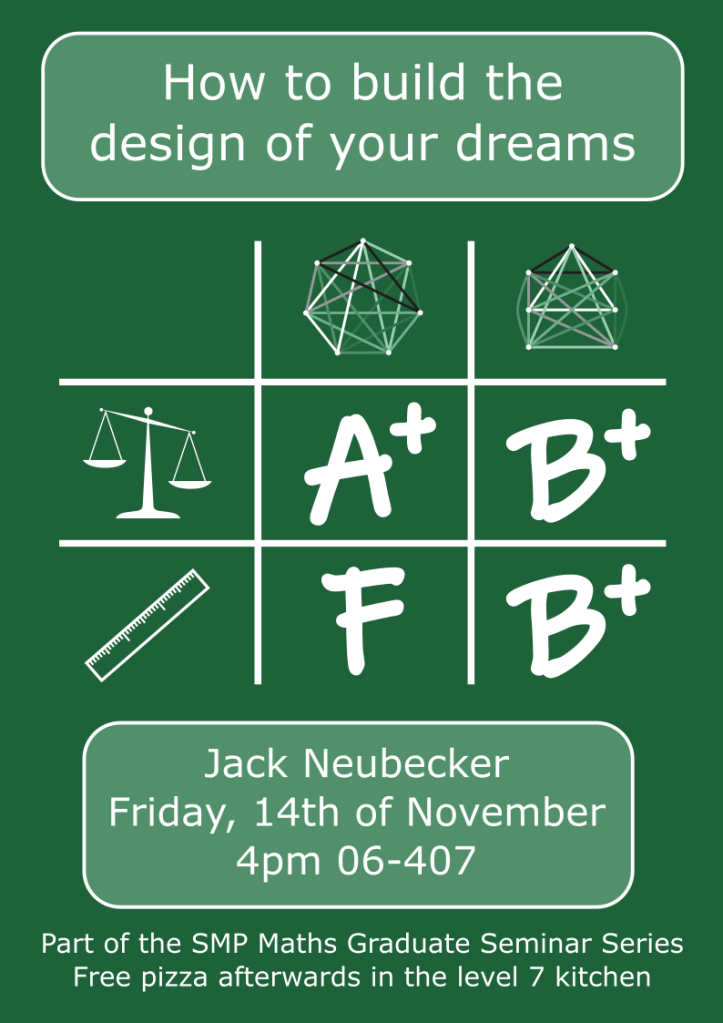
I can’t take credit for every element of creativity — I’m indebted to Wikimedia commons for some of the more complex graphics for which I lacked either the time or skills to create myself. I’m getting better and would like to expand my diagram production skills, and building off the work of those more competent than me is a great way to do that. I’m going to include the graphics I’ve used here so that you can infer by omission the work that is mine 🙂
I ‘m going to try to figure out how to make a diagram like the geodesic above, watch this space!
Yesterday, my first journal article was published in the Australasian Journal of Combinatorics! It’s completely open-access, so you can find the journal here and a pdf of the article here.
To celebrate, I thought I’d have a go at visualising some of the paper because, while I’m quite happy with the conciseness and completeness of the paper, I think some of the beauty has been obscured behind tables of integers.
In essence, the paper identifies a nice small object, and then gives necessary and sufficient conditions for the existence of a similarly nice object of different sizes. So I think it makes sense to focus on the nice small object that got everything started.
Below is an image of it, and I encourage you to play around with this interactive version on Desmos. It’s made up of 19 points (in black) and 57 triangles (coloured red, blue and green).
Here is a summary of the nice properties that define it:
Every unordered pair of points is the side of exactly one triangle. (Click on any line between a pair of points and it will highlight the rest of the triangle.)
For each point, there is a set of triangles (called an APC) which do not overlap in any points, and which includes every other point in one of the triangles. (Use the slider to select a point, and the APC which misses that point will be highlighted with filled-in triangles. Or just leave it to spin around!)
Every triangle appears in exactly two of these APCs. (This is a bit tricky to see, but notice how each APC has two triangles of each of the three colours? This means that as we spin around the APCs, there are exactly two rotations which will make the triangle we want appear.)
A set of triangles which satisfies (1) is called a Steiner triple system, or STS. They are very popular objects of study, and it is well known that they only exist if the number of points is one more than a multiple of 6. We call a set of triangles which satisfies (1), (2) and (3) an Almost resolvable when duplicated Steiner triple system, or ARDSTS. The rest of the paper can be summarised as achieving the following:
Show that an ARDSTS cannot exist with 7 or 13 points.
Building an ARDSTS for some small sizes (19, 25, 31, 37, 43, 49, 55, 61, 67, 73, 79, 85 and 103 points).
Building an ARDSTS for every other integer one more than a multiple of 6 by gluing together the ARDSTSs constructed in step 2 in a clever but not-so revolutionary way.
So we know that for every size where an ARDSTS can exist, one does exist. Nice! But… each example constructed in step (2) has the extra nice property that you can spin it around and the picture doesn’t change except for the labels of the points. (We call something with this symmetry cyclic.) This made them quite a lot easier to find on a computer, but the way we glue them together in step (3) ruins the symmetry. We suspect cyclic ARDSTSs exist for the bigger sizes as well, but we couldn’t prove it. So of course there’s always more work to be done!


You must be logged in to post a comment.